
A Detailed Guide to Using TCPdump for Network Analysis
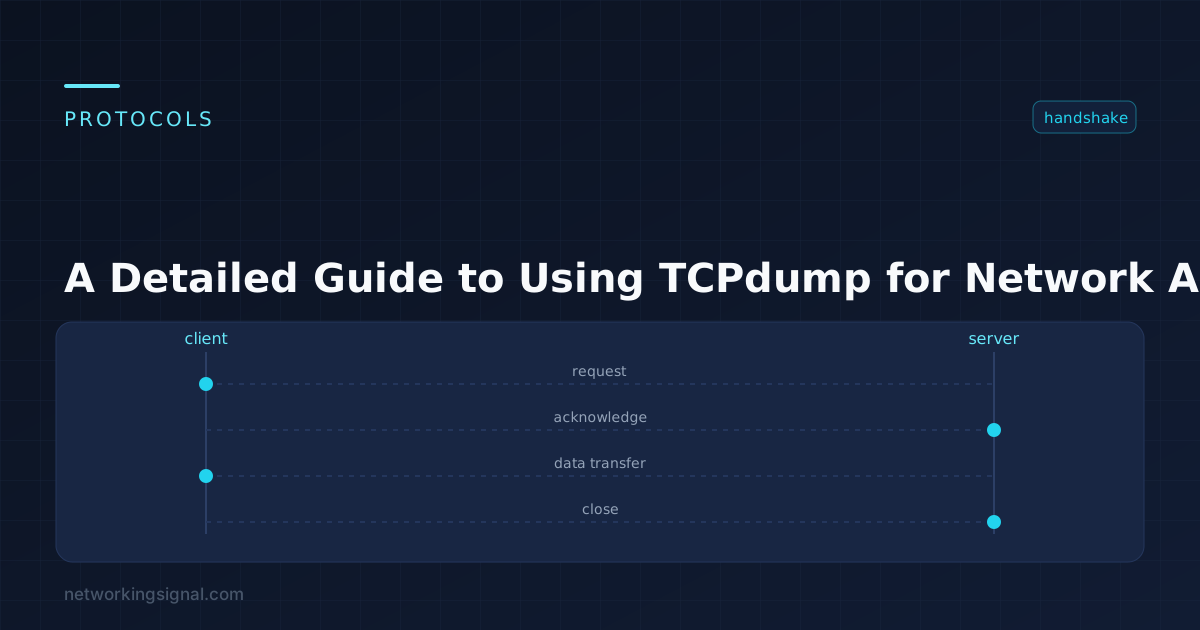
Network traffic analysis is a crucial skill for any IT professional dealing with networks and security. TCPdump is…
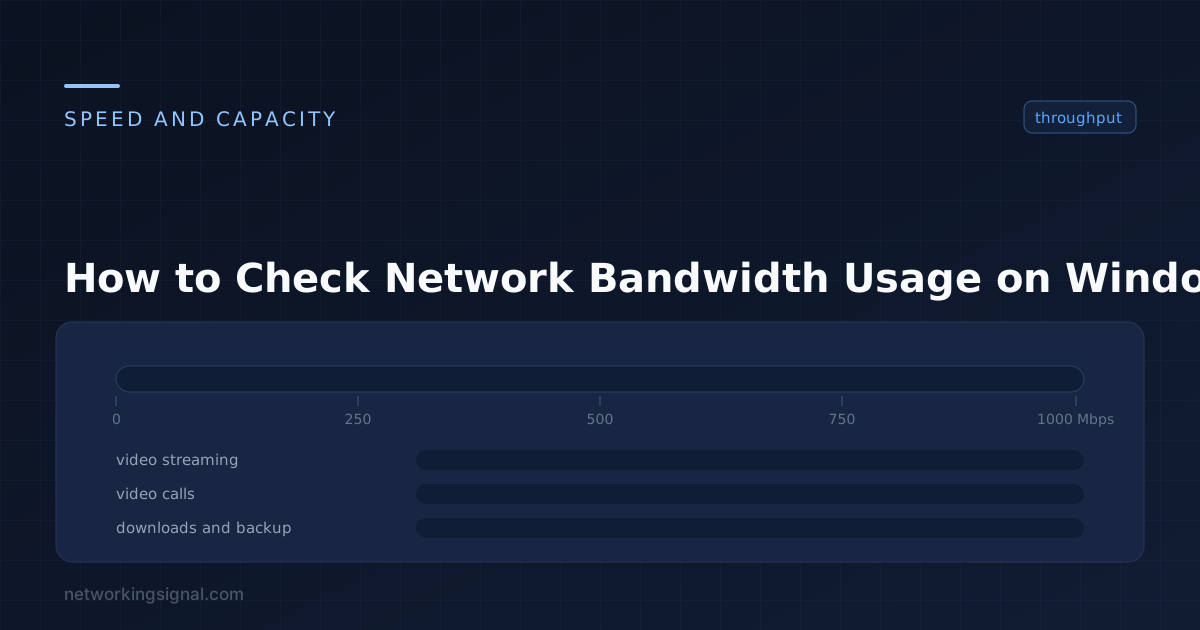
Windows has four built-in ways to see network activity, and they answer different questions. Picking the right one saves a lot of time.
| Question | Tool |
|---|---|
| What is my speed right now? | Task Manager |
| Which app is using the bandwidth? | Resource Monitor |
| How much have I used this month? | Settings → Data usage |
| What is the interface’s lifetime total? | PowerShell |
| Which remote address is it talking to? | Resource Monitor → TCP Connections |
Ctrl+Shift+Esc → Performance → pick your adapter.
You get a live graph, the current send and receive rate, the link speed, and the adapter’s IP addresses. The Processes tab has a Network column showing per-app usage, though you may need to right-click the column headers to add it.
Useful for “is anything using the connection at all” and for confirming the link negotiated at the expected speed. Task Manager’s per-process figures are approximate, for accuracy, use Resource Monitor.
This is the one worth learning. Open it with Win+R → resmon, or from Task Manager’s Performance tab.
The Network tab has four sections:
| Section | Shows |
|---|---|
| Processes with Network Activity | Every process, with send and receive rates in bytes per second |
| Network Activity | Each connection: process, remote address, and throughput |
| TCP Connections | Local and remote ports, latency, packet loss |
| Listening Ports | What is accepting inbound connections, useful for a security check |
Sort “Processes with Network Activity” by Total and you have your answer in seconds. The Network Activity section then tells you where that process is sending data, which is often the more interesting fact.
The Listening Ports section is worth a periodic look regardless, anything listening that you do not recognise deserves investigation.
Settings → Network & Internet → Advanced network settings → Data usage (the path varies slightly between Windows 10 and 11).
This shows the last 30 days, broken down per application, per adapter. It is the right tool for a metered connection or a data cap.
Two limitations: the window is fixed at 30 days, and the counter resets if you reset network settings or reinstall the adapter driver.
# Cumulative bytes since the adapter came up
Get-NetAdapterStatistics | Select-Object Name, ReceivedBytes, SentBytes

# Readable
Get-NetAdapterStatistics | ForEach-Object {
  [PSCustomObject]@{
    Name         = $_.Name
    ReceivedGB   = [math]::Round($_.ReceivedBytes / 1GB, 2)
    SentGB       = [math]::Round($_.SentBytes / 1GB, 2)
  }
}

# Live throughput, sampled once a second
Get-Counter '\Network Interface(*)\Bytes Total/sec' -Continuous -SampleInterval 1
Note that Get-NetAdapterStatistics counts from when the adapter last initialised, a reboot or a driver reload resets it to zero. It is not a monthly total.
Per-connection detail, with the owning process:
Get-NetTCPConnection -State Established |
  Select-Object LocalAddress, LocalPort, RemoteAddress, RemotePort,
    @{n='Process';e={(Get-Process -Id $_.OwningProcess -ErrorAction SilentlyContinue).ProcessName}} |
Sort-Object Processnetstat -e ! interface totals
netstat -e -s ! detailed per-protocol statistics
netstat -ano ! every connection with its PID
netstat -b ! connections with the executable name (needs admin)netstat -ano plus Task Manager’s PID column identifies an unexpected connection quickly.
ping your gateway and a public address, loss or high latency points at a different cause than saturation. See what is ping.Windows can only tell you about this machine. For household or network-wide visibility you need to look at the router or the switch:
If the goal is finding which device in the house is saturating the connection, the router’s statistics page answers it directly and no Windows tool will.
Resource Monitor (resmon) → Network tab → Processes with Network Activity, sorted by Total. It also shows the remote addresses each process is talking to.
Because the bottleneck is elsewhere. Another device may be saturating the connection, or the problem may be latency and packet loss rather than bandwidth. Check the router’s per-device statistics.
Settings → Network & Internet → Data usage shows the last 30 days per application. It resets if you reset network settings or reinstall the adapter driver.
A factor of 8. Network speed is in megabits per second; file sizes are in megabytes. A 100 Mbps connection downloads at about 12.5 MB/s.
netstat -ano lists every connection with its process ID, or Resource Monitor’s Listening Ports section shows the same with process names attached.
Not natively, beyond marking a connection as metered, which throttles Windows Update and some Store apps. Per-application limits need third-party software or QoS on the router.
Hand-picked articles you might also find useful.
 Routing & Switching
 Network traffic analysis is a crucial skill for any IT professional dealing with networks and security. TCPdump is…
 Routing & Switching
 What is Patch Panel? A patch panel is a component of structured cabling that facilitates the connection, organization,…
 Routing & Switching
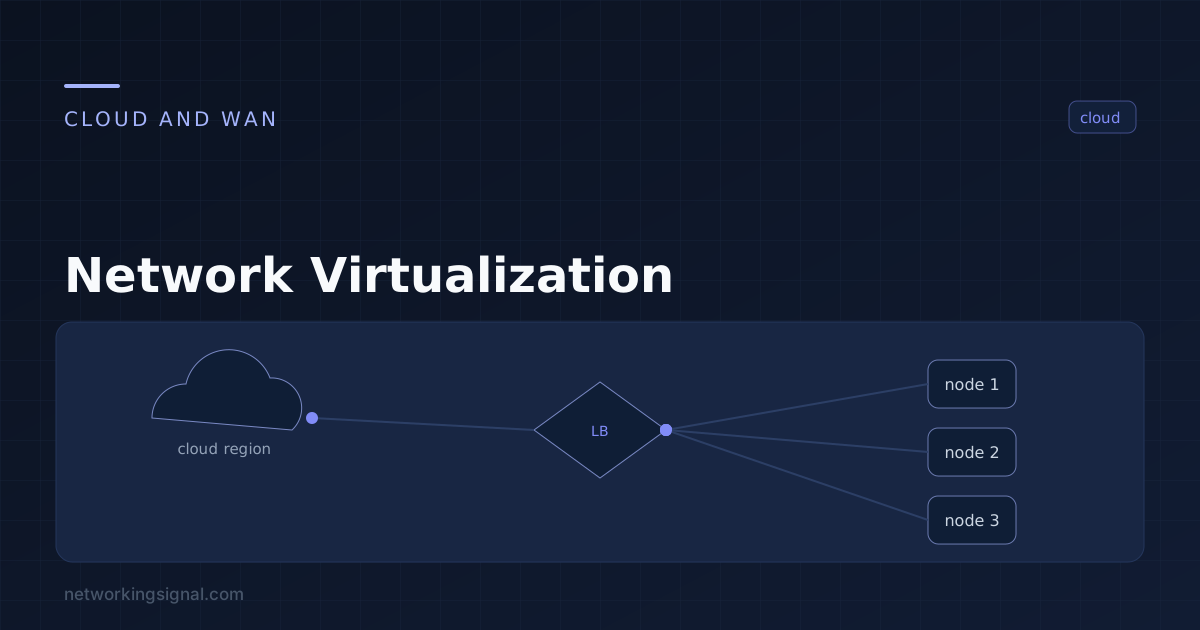
 What is Network Virtualization? Network virtualization is a technique of creating multiple logical networks over a single physical…