
Bandwidth Calculator — How Many Mbps Do You Actually Need?
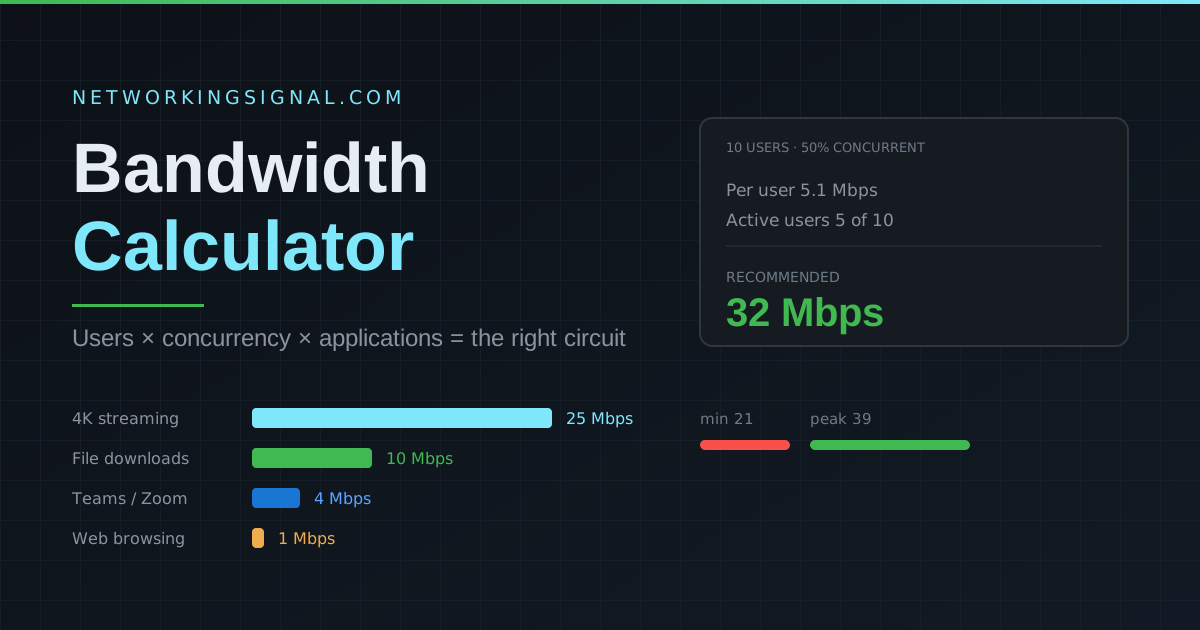
Work out how much internet bandwidth your home or office really needs. Accounts for user count, concurrency and…
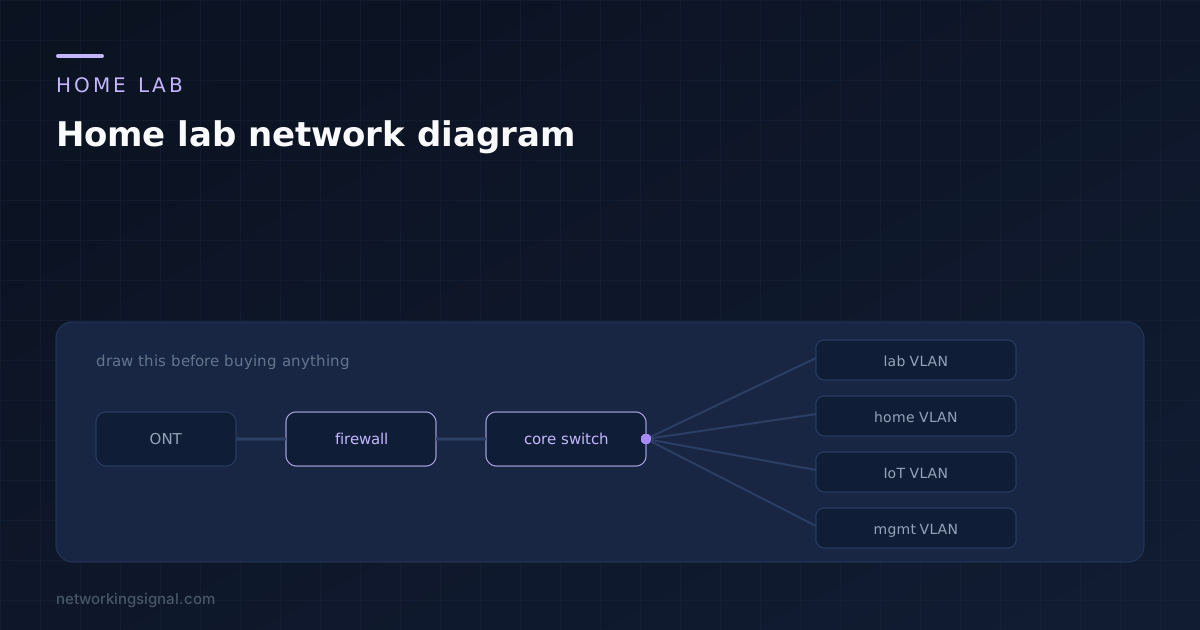
A home lab network diagram is worth an hour before anything is bought, because the expensive mistakes are all decided at that point. Port count, where cable runs, how much PoE you need and how many segments you want are all trivial to change on paper and awkward to change once there is hardware on a shelf.
An hour with a pencil saves a switch you did not need and a cable run through the wrong wall. This is what to put in the drawing and how to keep it useful afterwards.
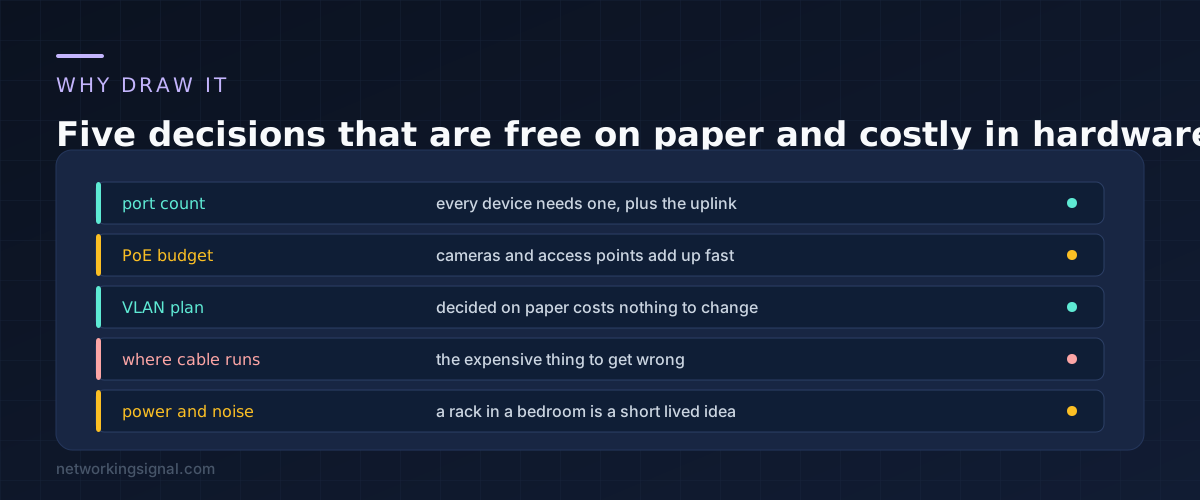
Port count. Count every device, then add the uplink, then add four. People buy an eight port switch, fill it, and buy a second one within a month. A sixteen port switch bought once is cheaper than two eights and one fewer hop.
PoE budget. Access points and cameras draw real power and a switch has a total budget, not just per port. Adding them up on paper is the only way to know whether you need the PoE model or the higher budget version. Our PoE power budget calculator does the sum, including the worst case class allocation figure that actually exhausts a switch.
The VLAN plan. Deciding segments on paper is free. Renumbering a live lab because you ran out of room in a subnet is a weekend.
Where cable runs. The single most expensive item to get wrong, because it involves walls. Mark every run and its length before drilling anything.
Power and noise. Enterprise switches are loud and warm. Working out on paper that the rack has to live in a garage rather than a bedroom changes which cable runs you need, which is why it belongs in the diagram rather than in a later regret.
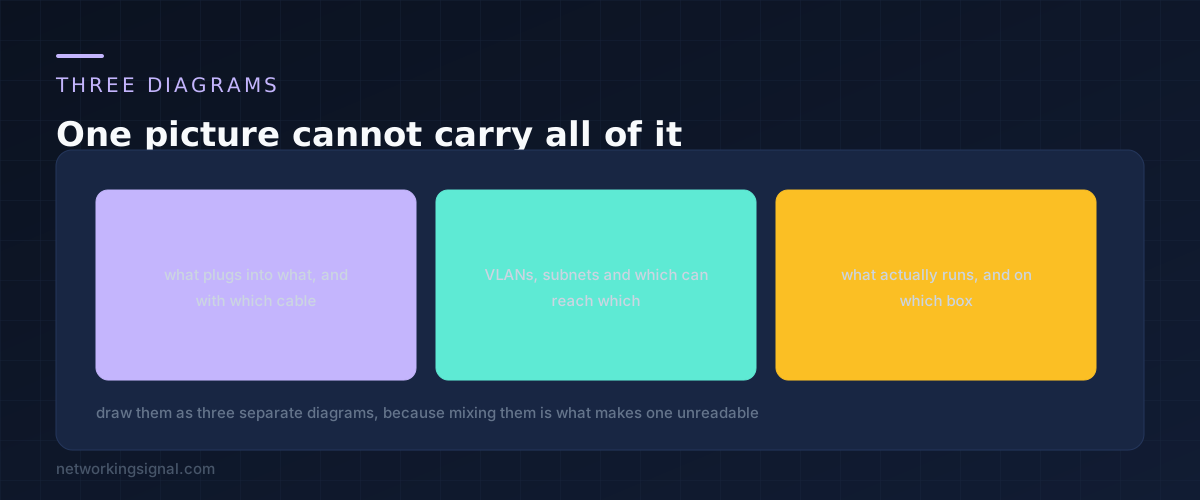
The reason most home lab diagrams become useless is that they try to show cables, VLANs and running services at once. Separate them.
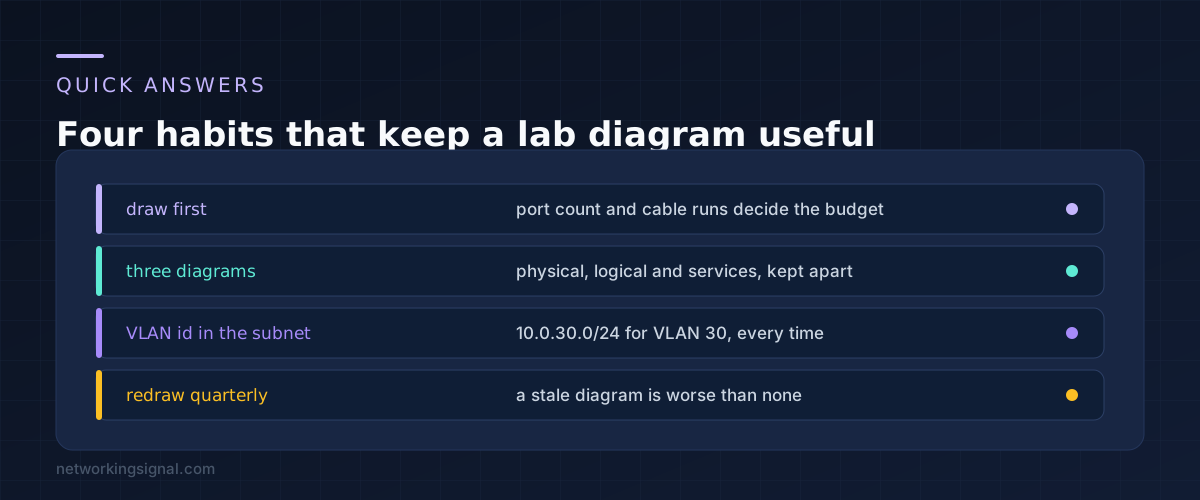
The physical diagram shows boxes and the cables between them. Port numbers, cable type, run lengths. This is the one you take to the hardware shop and the one you use when something is unplugged.
The logical diagram shows VLANs, subnets, gateways and which segment can reach which. No cables at all. This is the one you use when traffic is not flowing and you need to remember what should be allowed.
The services diagram shows what actually runs and where. Which host runs the hypervisor, where DNS lives, what depends on what. This is the one that tells you what breaks when you reboot a box.
Each is simple on its own. Combined, they are a diagram nobody updates.
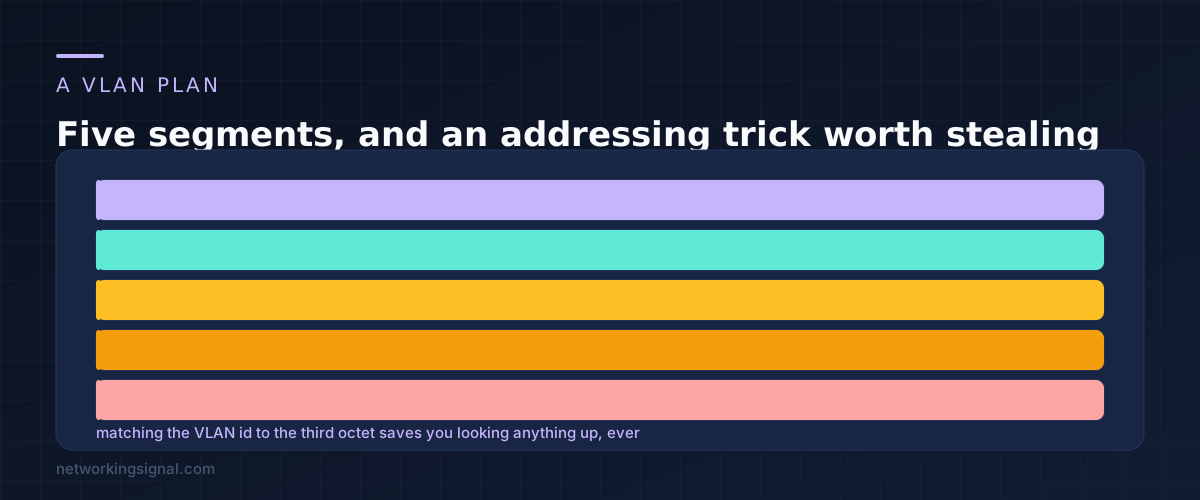
Five segments cover almost every home lab, and leaving gaps between the numbers means you can insert one later without renumbering.
Management holds switches, the firewall and any out of band interfaces, and nothing else should be able to reach it. Home is the network the rest of the household uses, and it should be the one that keeps working when you break something. Lab is where you break things. IoT holds the devices you do not trust, which we covered in setting up an IoT VLAN at home. Isolated is for anything that should reach the internet and nothing else.
The habit worth stealing is matching the VLAN id to the third octet of the subnet. VLAN 30 becomes 10.0.30.0/24. Once you do this, reading an address tells you the segment without checking any documentation, which matters most at the moment you are least inclined to check documentation.
Keep the household on a segment that survives your experiments. The fastest way to lose interest in a home lab is to take the house offline with it twice.
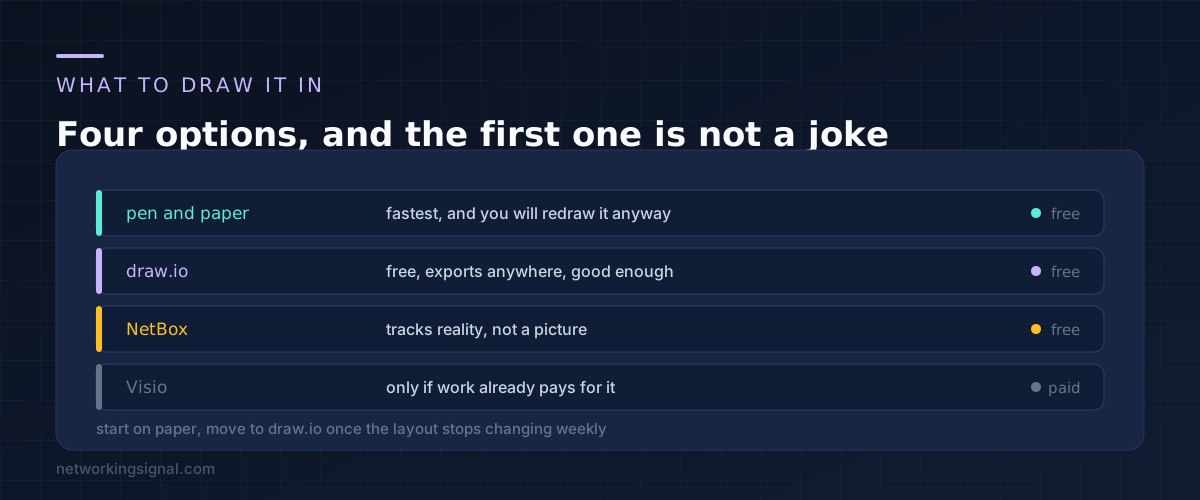
Start on paper. In the first weeks the design changes every time you learn something, and redrawing by hand is faster than dragging boxes.
Move to draw.io once the shape stops changing. It is free, it runs in a browser, it exports to formats you can open in five years, and it is more than capable for a home lab. Keep the file somewhere that is not only on the lab you are documenting, which is a mistake people make exactly once.
NetBox is a different category. It is a source of truth database rather than a drawing, tracking devices, addresses and cables as data. It is excellent and it is more effort than a home lab usually justifies, so treat it as something to grow into.
Whatever you use, put the date on it. A diagram you cannot date is a diagram you cannot trust.
Down to the port number on every switch. That is the level where it saves you time later, because tracing a cable is the thing you least want to do at eleven at night.
Not on day one. You need them the moment the lab shares a network with the household, because that is when breaking something has an audience. One segment for the lab and one for everyone else is enough to start.
Whenever you change hardware, and otherwise once a quarter. A diagram that is quietly wrong is worse than no diagram, because you will trust it while troubleshooting and lose an hour to something that is not true any more.
Subnets and gateways yes, individual hosts no. Host addresses change too often and belong in a text file or in DNS. Putting them in the picture is what makes people stop updating it.
You still need the logical and services diagrams, and the physical one shrinks to one host and its uplink. Virtual labs get complicated faster than physical ones because nothing is visible, which makes the drawing more useful rather than less. Our guide to building a CCNA home lab covers the virtual options.
Hand-picked articles you might also find useful.
 Networking Fundamentals
 Work out how much internet bandwidth your home or office really needs. Accounts for user count, concurrency and…
![Top 50 Networking Interview Questions and Answers [2026]](https://www.networkingsignal.com/wp-content/uploads/2026/07/art-interview-questions.svg) Interview Questions
Interview Questions Networking interview questions test your knowledge of OSI model, TCP/IP, subnetting, routing protocols (BGP, OSPF), switching (VLANs, STP),…
 Networking Fundamentals
 What is an SD-WAN Controller? SDWAN Controller is a software-defined wide area network ( SD-WAN ) solution that…